ashtop
10 minute read
ashtop - the Swiss Army Knife for ASH

Tanel Poder's script "ashtop.sql" greatly simplifies querying ASH and is essentially a fully parameterizable "grep" for ASH. The script comes in two variants:
ashtop.sql → for querying ASH: gv$active_session_history
dashtop.sql → for querying DASH: dba_hist_active_sess_history
Both scripts are in the “ash” directory of Tanel’s github: https://github.com/tanelpoder/tpt-oracle
Pro tip: do yourself a favour and download the whole repository. There are many, many more very useful scripts for all kinds of DBA tasks.
There’s also a very good video by Tanel on YouTube that explains how ashtop works:
https://www.youtube.com/watch?v=D7bg1Am7Y9s
To use ashtop efficiently, it is necessary to know the structure of ASH and how it works. If you haven’t read it yet, check out this post: Active Session History. Note: whenever I mention “ASH” or “ashtop”, the same is true for “DASH” and “dashtop”.
Syntax
The basic syntax is very simple:
@ashtop <GROUP BY> <FILTER> <BEGIN_TIME> <END_TIME>;
- GROUP BY: What to group by, e.g., session_id, sql_id, event
- FILTER: What to filter by, e.g.,
session_type='FOREGROUND'orevent like 'gc%' - BEGIN_TIME: From which point in time, e.g.,
sysdate-1/24 - END_TIME: Until which point in time, e.g.,
sysdate
Structure of ashtop
This is the basic structure of the script, quite similar to the basic script covered in the post about ASH. However, the complete script has over 130 lines ;)
SELECT
&1
, COUNT(*) "TotalSeconds"
FROM
gv$active_session_history a
, dba_users u
, dba_objects o
WHERE
 a.user_id = u.user_id (+)
AND a.current_obj# = o.object_id(+)
AND &2
AND sample_time BETWEEN &3 AND &4
GROUP BY
&1
ORDER BY
"TotalSeconds" DESC
, &1
Time specifications
BEGIN and END_TIME can be passed to the script in various ways, mixed forms are also possible:
- Relative to sysdate:
@ashtop username,sql_id session_type='FOREGROUND' sysdate-1/24/12 sysdate;
- ANSI syntax 1:
@ashtop username,sql_id session_type='FOREGROUND' DATE'2021-08-24' DATE'2021-08-25';
- ANSI syntax 2:
@ashtop username,sql_id session_type='FOREGROUND' "TIMESTAMP'2024-04-17 18:00:00'" "TIMESTAMP'2024-04-17 20:00:00'";
- to_date:
@ashtop username,sql_id session_type='FOREGROUND' "to_date('24-AUG-21 18:00', 'DD-MON-YY HH24:MI')" sysdate;
More info on using ANSI syntax in Tanel’s scripts:
https://tanelpoder.com/2012/12/29/a-tip-for-lazy-oracle-users-type-less-with-ansi-date-and-timestamp-sql-syntax/
Derived columns
The script includes various derived columns that do not exist like this in ASH.
username and objt
Users and objects are only listed as IDs in ASH; if you want the names, you have to join dba_user and dba_objects. Ashtop simplifies this with the columns username and objt. These columns can be used as GROUP BY and as filters.
For example, to show the top 15 users accessing an object named “TABLE_NAME”:
@ashtop username "objt='TABLE_NAME'" sysdate-1/24 sysdate;
Or the top objects accessed by the user “USER”:
@ashtop objt "username='USER'" sysdate-1/24 sysdate;
The script always returns the top 15 rows that match the specified arguments. Usually, that’s enough, but it also means you don’t see the rest of the waits. If you can’t find the cause of a problem with ashtop, you should analyze the ASH with the basic script described in the post about ASH.
event2
When a session is on the CPU, the EVENT column is NULL. To see that it was really on the CPU, you would have to output SESSION_STATE as well:
@ashtop sql_id,session_state,event 1=1 sysdate-1/24 sysdate;
Example output:
| Seconds | AAS | %This | SQL_ID | SESSION | EVENT | FIRST_SEEN | LAST_SEEN | Execs Seen |
|---|---|---|---|---|---|---|---|---|
| 2343 | .7 | 5% | c0syzmwpwp3mw | ON CPU | 2021-09-10 12:44:19 | 2021-09-10 13:44:16 | 1449 | |
| 1524 | .4 | 3% | fj40waf596jva | ON CPU | 2021-09-10 12:44:21 | 2021-09-10 13:44:16 | 7 |
To avoid having to always specify session_state, you can simply use the column “event2”:
@ashtop sql_id,event2 1=1 sysdate-1/24 sysdate;
Example output:
| Seconds | AAS | %This | SQL_ID | EVENT2 | FIRST_SEEN | LAST_SEEN | Execs Seen |
|---|---|---|---|---|---|---|---|
| 2343 | .7 | 5% | c0syzmwpwp3mw | ON CPU | 2021-09-10 12:44:32 | 2021-09-10 13:44:29 | 1449 |
| 1528 | .4 | 3% | fj40waf596jva | ON CPU | 2021-09-10 12:44:30 | 2021-09-10 13:44:29 | 7 |
A value of 1 for AAS and “ON CPU” EVENT2 means that approximately one CPU core was busy with this execution. The value scales; AAS of 5 means 5 cores were busy.
time_model_name
ASH offers many columns that show which step of execution the query was currently in, e.g. Hard Parse or SQL Execution:
| Column | Description |
|---|---|
| IN_CONNECTION_MGMT | Was the session doing connection management at sampling? (Y/N) |
| IN_PARSE | Was the session parsing at sampling? (Y/N) |
| IN_HARD_PARSE | Was the session hard parsing at sampling? (Y/N) |
| IN_SQL_EXECUTION | Was the session executing SQL at sampling? (Y/N) |
| IN_PLSQL_EXECUTION | Was the session executing PL/SQL at sampling? (Y/N) |
| IN_PLSQL_RPC | Was the session executing inbound PL/SQL RPC at sampling? (Y/N) |
| IN_PLSQL_COMPILATION | Was the session compiling PL/SQL at sampling? (Y/N) |
| IN_JAVA_EXECUTION | Was the session executing Java at sampling? (Y/N) |
| IN_BIND | Was the session doing bind operations at sampling? (Y/N) |
| IN_CURSOR_CLOSE | Was the session closing a cursor at sampling? (Y/N) |
| IN_SEQUENCE_LOAD | Was the session loading in sequence at sampling? (Y/N) |
| IN_INMEMORY_QUERY | Was the session querying In-Memory Column Store? (Y/N) |
| IN_INMEMORY_POPULATE | Was the session populating IM column store? (Y/N) |
| IN_INMEMORY_PREPOPULATE | Was the session prepopulating IM column store? (Y/N) |
| IN_INMEMORY_REPOPULATE | Was the session repopulating IM column store? (Y/N) |
| IN_INMEMORY_TREPOPULATE | Was the session trickle repopulating IM column store? (Y/N) |
| IN_TABLESPACE_ENCRYPTION | Was encryption/decryption of a tablespace occurring? (Y/N) |
To avoid passing all these columns as arguments to ashtop, you can use the derived column “time_model_name”. It is based on the ASH “Time_Model” bitfield and maps the value to a descriptive text:
@ashtop sql_id,time_model_name 1=1 sysdate-1/24 sysdate;
Example output:
| Seconds | AAS | %This | SQL_ID | TIME_MODEL_NAME | FIRST_SEEN | LAST_SEEN | Execs Seen |
|---|---|---|---|---|---|---|---|
| 737 | .2 | 4% | g9u23ytkurdwz | SQL_EXECUTION | 2021-09-13 12:18:58 | 2021-09-13 13:16:23 | 737 |
| 549 | .2 | 3% | CONNECTION_MGMT | 2021-09-13 12:19:03 | 2021-09-13 13:18:27 | 1 | |
| 480 | .1 | 3% | 1pyct56psc65z | SQL_EXECUTION | 2021-09-13 12:19:03 | 2021-09-13 13:18:51 | 480 |
| 478 | .1 | 3% | 6u8vh1hymdfh3 | SQL_EXECUTION | 2021-09-13 12:18:54 | 2021-09-13 13:18:52 | 478 |
Meaning of some of the time_model_name
| Time_Model_Name | Meaning |
|---|---|
| SQL_EXECUTION | Statement is being executed |
| PARSE | Soft parse |
| HARD_PARSE | Hard parse |
| PARSE HARD_PARSE | Soft parse attempted, ended in hard parse |
| CONNECTION_MGMT | Login/Logouts |
| BIND | Binds are being filled |
| (Empty line) | Step not represented in ASH |
Empty SQL_ID
Sometimes ashtop shows no SQL_ID for a session, either because the session belongs to a background process (in that case, the user is SYS and SESSION_TYPE is BACKGROUND) or because the session is mainly waiting for commits.
@ashtop sql_id,event2,username 1=1 sysdate-1/24 sysdate;
Example output:
| Seconds | AAS | %This | SQL_ID | EVENT2 | USERNAME | SESSION_TYPE | FIRST_SEEN | LAST_SEEN | Execs Seen |
|---|---|---|---|---|---|---|---|---|---|
| 3068 | .9 | 57% | log file sync | RAPHI_APPL | FOREGROUND | 2021-09-13 11:50:28 | 2021-09-13 12:50:23 | 1 | |
| 809 | .2 | 15% | ON CPU | RAPHI_APPL | FOREGROUND | 2021-09-13 11:50:26 | 2021-09-13 12:50:21 | 1 | |
| 100 | .0 | 2% | ON CPU | SYS | BACKGROUND | 2021-09-13 11:51:19 | 2021-09-13 12:50:03 | 1 |
If you want to see what the user session is actually doing even though no SQL_ID is listed, you can search for “Top_Level_Call_Name”:
@ashtop sql_id,top_level_call_name,event2 "sql_id is null and username='RAPHI_APPL'" sysdate-1/24 sysdate;
Example output:
| Seconds | AAS | %This | SQL_ID | TOP_LEVEL_CALL_NAME | EVENT2 | FIRST_SEEN | LAST_SEEN | Execs Seen |
|---|---|---|---|---|---|---|---|---|
| 2879 | .8 | 65% | COMMIT | log file sync | 2021-09-13 11:54:40 | 2021-09-13 12:54:38 | 1 | |
| 195 | .1 | 4% | COMMIT | ON CPU | 2021-09-13 11:55:09 | 2021-09-13 12:54:13 | 1 | |
| 183 | .1 | 4% | V8 Bundled Exec | ON CPU | 2021-09-13 11:55:56 | 2021-09-13 12:54:05 | 1 |
Formatting
Tanel assumes you use his scripts in a terminal where you can scroll horizontally. If not, you should at least increase the linesize and maybe shorten a few columns:
set lines 400
col objt format a30
col event format a30
Customizing ashtop.sql
Sometimes it is necessary to customize ashtop.sql, for example to show more than the top 15 events or to sort by another criteria. It’s best to create a copy of the original ashtop.sql before you customize it.
cp /nas/smdb/scripts/sql/ash/ashtop.sql ${HOME}
cd ${HOME}
vi ashtop.sql
Change the order by and the number of rows returned:
ORDER BY
       -- TotalSeconds DESC
       time_waited DESC
       , &1
...
-- ROWNUM <= 15
    ROWNUM <= 30
Working with a copy of the ASH
If a copy of the ASH has been created with CTAS for backup, the following line needs to be changed to the saved ASH:
cp /nas/smdb/scripts/sql/ash/ashtop.sql ${HOME}
cd ${HOME}
vi ashtop.sql
-- FROM gv$active_session_history a) a
   FROM ash_save220901 a) a
Using ashtop
A simple query looks like this, the structure is always the same:
@ashtop username,sql_id session_type='FOREGROUND' sysdate-1/24 sysdate;
Example output:
| Seconds | AAS | %This | USERNAME | SQL_ID | FIRST_SEEN | LAST_SEEN | Execs Seen |
|---|---|---|---|---|---|---|---|
| 1184 | .2 | 9% | RAPHI_USER | 37hs5hm167vhy | 2019-11-26 12:35:38 | 2019-11-26 12:40:24 | 2 |
| 583 | .1 | 4% | RAPHI_APPL | bxj6rfn7du7c8 | 2019-11-26 11:57:30 | 2019-11-26 12:54:25 | 2 |
| 378 | .1 | 3% | RAPHI_APPL | 9jwmpa0zs1czv | 2019-11-26 12:02:15 | 2019-11-26 12:03:23 | 1 |
| … | … | … | … | … | … | … | … |
- First, these three columns are listed:
- Total Seconds: How many seconds all executions of the query are listed in ASH for the specified period
- AAS: Average Active Sessions spent per second with the wait event in the specified period
- %This: Ratio of the specified period to seconds all sessions spent with this event
- Then, the columns passed as the first argument (GROUP BY) are shown:
- USERNAME
- SQL_ID
- Lastly, some timing information
- FIRST_SEEN: First execution in the specified period
- LAST_SEEN: Last execution in the specified period
- Distinct Execs Seen: Number of different executions in the specified period
Example queries
There are countless ways to query ASH with ashtop, here is a selection:
Top events of the last hour
@ashtop event2 1=1 sysdate-1/24 sysdate;
Top waits of the last 5 minutes
@ashtop event2 "event2 not like 'ON CPU'" sysdate-1/24/12 sysdate;
Sessions with highest CPU usage
@ashtop session_id,sql_id "event2='ON CPU'" sysdate-1/24 sysdate;
Sessions with the highest I/O waits
@ashtop session_id,sql_id,event2 "wait_class = 'User I/O'" sysdate-1/24 sysdate;
What was the application doing
Assuminge all application users begin with RAPHI_
@ashtop sql_id,sql_opname,event2 "username like 'RAPHI%'" sysdate-1/24 sysdate;
What was a specific session doing
@ashtop sql_id,sql_opname,event2 "session_id=1667 and session_serial#=45570" sysdate-1/24 sysdate;
Which waits on which objects
@ashtop objt,event2,sql_id "event2 NOT LIKE 'ON CPU'" sysdate-1/24 sysdate;
Which SQL statement read the longest from what
@ashtop objt,sql_id "event like '%read%'" sysdate-1/24 sysdate;
What caused the most log file syncs
@ashtop sql_opname,top_level_call_name "event='log file sync'" sysdate-1/24 sysdate;
Are top sessions blocked by another session
@ashtop session_id,sql_id,event2,blocking_session session_type='FOREGROUND' sysdate-1/24 sysdate;
Top blocked sessions
@ashtop session_id,sql_id,event2,blocking_session "event2 NOT LIKE 'ON CPU' and blocking_session is not null" sysdate-1/24 sysdate;
On which objects blocked sessions each other
@ashtop username,sql_id,session_id,event,blocking_session,objt "event like 'enq: TX%'" sysdate-1/24 sysdate;
Highest PGA usage
Change the ORDER BY in a copy of ashtop.sql
vi ashtop.sql
ORDER BY
-- TotalSeconds DESC
 PGA_ALLOCATED DESC
Then:
@ashtop pga_allocated,sql_id "session_type='FOREGROUND'" sysdate-1/24 sysdate;
SQL plan statistics
With ASH it’s possible to find out in which step of the execution plan the query spent the most time. It can be done with ashtop or with another script from Tanel, asqlmon.
With ashtop
Unless specified with a hint, SQL Monitor only records statements that ran at least for 5 seconds. If you want to know which part of the execution plan consumed the most time for a query not captured by SQL Monitor, you have to use ASH. The following columns are available:
| Column | Description |
|---|---|
| SQL_FULL_PLAN_HASH_VALUE | Numerical representation of the complete SQL plan for the cursor |
| SQL_PLAN_HASH_VALUE | Numeric representation of the SQL plan for the cursor |
| SQL_PLAN_LINE_ID | SQL plan line ID |
| SQL_PLAN_OPERATION | Plan operation name |
| SQL_PLAN_OPTIONS | Plan operation options |
With the SQL_ID of the statement, you can see where most of the time was spent:
@ashtop sql_plan_line_id,sql_plan_operation,sql_plan_options "sql_id='28w88hbtt3766'" sysdate-1/24 sysdate;
Example output:
| Seconds | AAS | %This | SQL_PLAN_LINE_ID | SQL_PLAN_OPERATION | SQL_PLAN_OPTIONS | FIRST_SEEN | LAST_SEEN | Execs Seen |
|---|---|---|---|---|---|---|---|---|
| 387 | .1 | 58% | 8 | TABLE ACCESS | BY LOCAL INDEX ROWID BATCHED | 2021-09-13 10:38:46 | 2021-09-13 11:11:32 | 159 |
| 136 | .0 | 20% | 9 | INDEX | RANGE SCAN | 2021-09-13 10:38:46 | 2021-09-13 11:11:31 | 114 |
| 108 | .0 | 16% | 15 | TABLE ACCESS | BY LOCAL INDEX ROWID BATCHED | 2021-09-13 10:38:50 | 2021-09-13 11:11:33 | 108 |
| 27 | .0 | 4% | 16 | INDEX | SKIP SCAN | 2021-09-13 10:38:50 | 2021-09-13 11:11:32 | 27 |
| 4 | .0 | 1% | 3 | SORT | UNIQUE | 2021-09-13 10:38:49 | 2021-09-13 11:11:27 | 4 |
| 3 | .0 | 0% | 11 | TABLE ACCESS | BY GLOBAL INDEX ROWID BATCHED | 2021-09-13 10:38:47 | 2021-09-13 10:38:53 | 3 |
| 2 | .0 | 0% | 12 | INDEX | RANGE SCAN | 2021-09-13 10:38:48 | 2021-09-13 11:11:24 | 2 |
| 1 | .0 | 0% | 5 | FILTER | 2021-09-13 10:38:46 | 2021-09-13 10:38:46 | 1 |
This means that the query spent 58% of its time reading rows from a table, 20% searching the rows in the index, etc.
With asqlmon
Also in the “ash” directory of Tanel’s github repo is the script asqlmon.sql:
https://github.com/tanelpoder/tpt-oracle
The script simplifies querying plan statistics and provides even more information.
- First argument: sql_id
- Second argument: Plan Hash Value (or % for all plans)
- Third argument: Start time
- Fourth argument: End time
Call for the same query as in the ashtop example:
@asqlmon 28w88hbtt3766 % sysdate-1/24 sysdate;
Output:
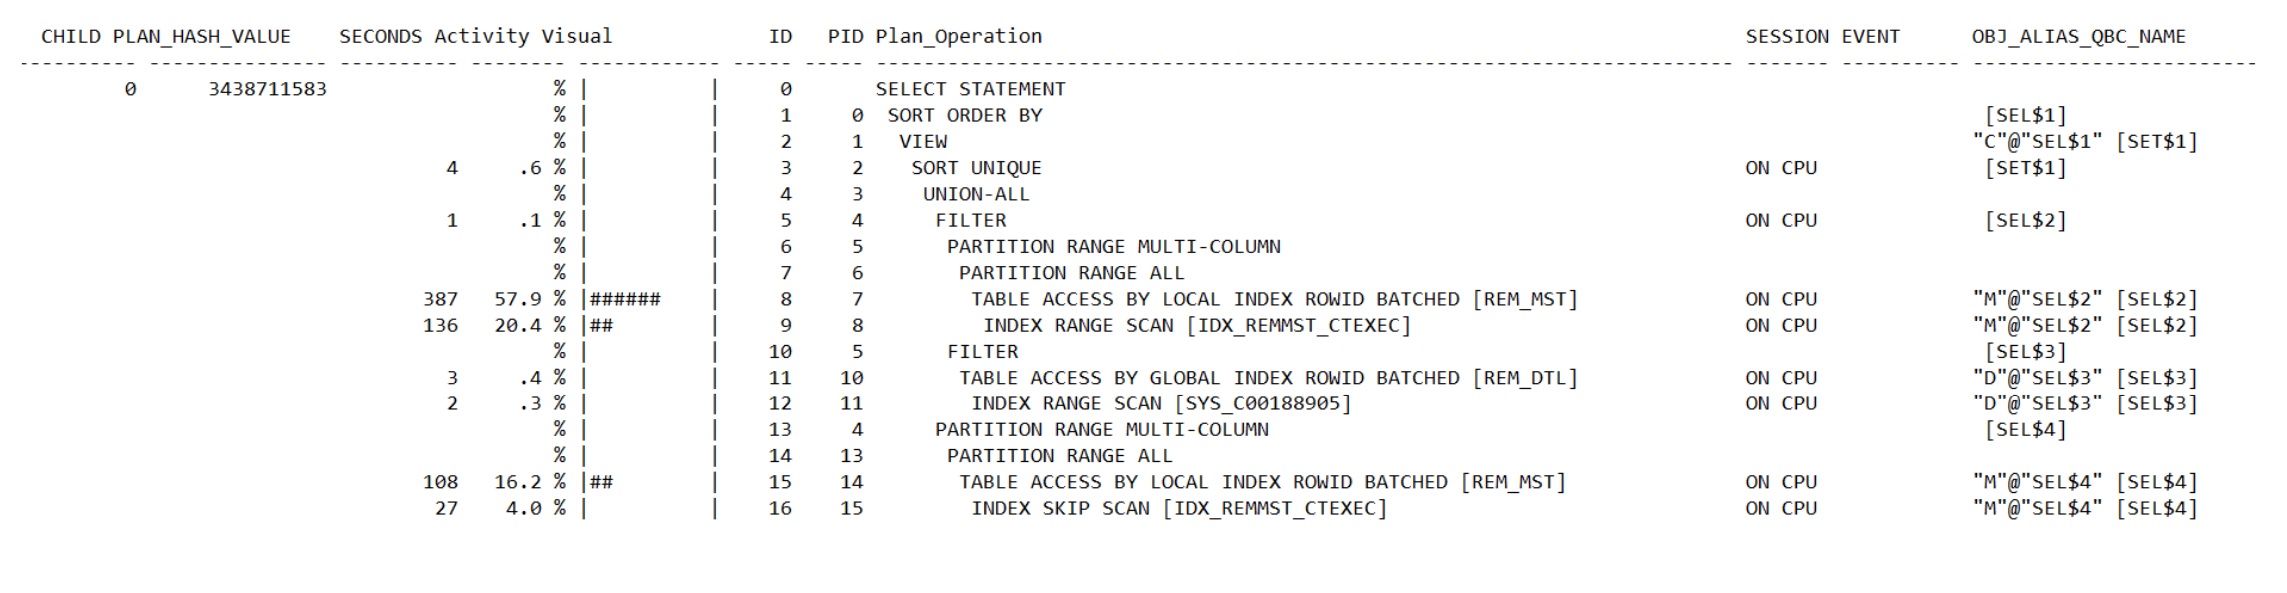
Conclusion
Ashtop is a true time saver when it comes to working with ASH. It is much more flexible than “Top Activity/ASH Analytics” in Oracle’s Enterprise Manager and provides some very handy shortcuts which have to be programmed when using self-made scripts, like the time_model_name column. Other useful scripts from Tanel that go hand-in-hand with ashtop:
- awr_sqlstats_per_exec -> discover plan changes of a query
- (d)ash_wait_chains -> follow blocking sessions
- (d)aslqmon -> execution plan statistics, as described above
- nonshared -> show reasons why cursors were not shared
- help.sql -> description for many of Tanel’s scripts